ACT Correlation Parameters
The
correlation option determines the relationship (the correlation) between
signal tracks. The resulting matrix of correlation coefficients can be viewed
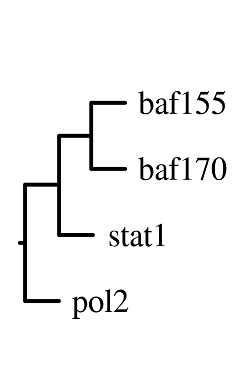
as, for example, a phylogeny tree showing the relationship between various
transcription factors based on their signal values on a microarray. It does
this using the method to correlate two signal tracks described in Genome Res
17: 787-97; however, it allows for simultaneous analysis of several signal
tracks at once and leaves several parameters, including number of boostrap cycles and window size, flexible.
To
perform the correlation calculations, the program converts the uploaded signal
files into binary hit files where each nucleotide position is assigned to
either 1 (indicating that the position is an active hit) or 0. It then
calculates Pearsons correlation coefficient for each combination of signal
track uploaded; however, so that the spatial distribution of the hits is not
disregarded, it does the calculation based on a sliding window in which a
certain number of nucleotides at a time are aggregated and used as values for
the Pearson correlation coefficient calculation.
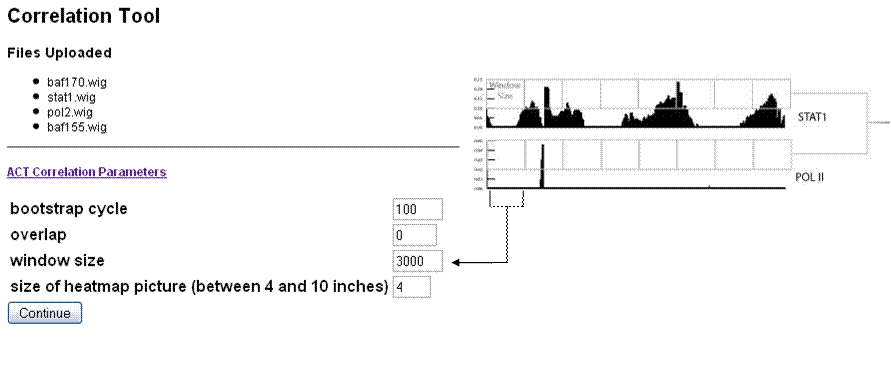
Bootstrap cycle. Number of times to resample and
recalculate the correlation coefficient when generating phylogenetic
trees. This is done using phylip.
Overlap. The number of base pairs of overlap when the
aggregation window slides. For
example, in Genome Res
17: 787-97 a sliding window size of 3kb was used, with an overlap of 1.5kb.
Window
size. Specifies the size of the sliding window in base pairs. For example, in Genome Res
17: 787-97 a sliding window size of 3kb was used, with an overlap of 1.5kb.
Size of heatmap picture. Length of the generated heatmap figure in inches.
Output
The
output comes in the form of several files, perhaps the most important of which
is the file tracks_regions-data_matrix_original.txt
which contains a matrix with correlation coefficients describing how each
factor is related to every other. The rows and columns are in the order that
the original files were inputted. In addition, the program generates a
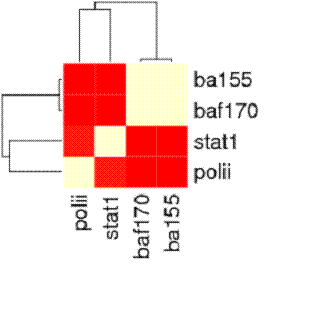
graphical heatmap output file (in the form of a png and pdf using R's heatmap
function.) and a phylogenetic diagram showing the
relationships between the inputted signal files (tree.png).
The results from each individual boostrap run can be
found in the bootstrap folder.