ACT Aggregation Parameters
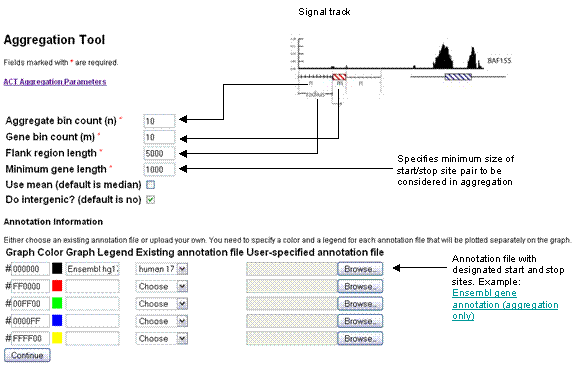
This option provides an easy
way to calculate the average signal of probes on a device such as a microarray
versus their position relative to a set of annotation coordinates. These
coordinates can correspond to any start and end pairs, such as those of a set
of annotated genes. The hope is that by taking the aggregate signal across many
locations that noise spots will cancel out, and it can be determined whether or
not there really is a correlation between, say, a transcription factor and its
location on a gene.
There are a couple of modes
the tool can assume: in the first, only one annotation coordinate is considered
in the calculation. A preset number of bins (see parameters: n) extend a predetermined number of base
pairs (see parameters: Flank Region
Length) in both directions of what are defined as the start positions in
the annotation file. The second option allows for a certain number of bins, m to correspond to the locations between
the start and stop locations of each pair in the annotation file.
Because the distance between
start end points of genes can vary, the tool divides each start/end pair into m bins. The first bin encompasses the
probes within the first 1/mth of the gene, the second bin the second 1/mth, and
so on. The tool also reports an average signal for n bins outside the start/end pair. These are not scaled based on
the length of the gene. Rather, they extend a certain number of base pairs (radius) before the start site and after
the stop site. It should be noted that the tool is designed to invert the start
and end points if the annotated object in question is transcribed on the
reverse strand instead of the forward strand.
Annotation file. Tab-delimited file containing several start and end positions,
chromosome locations, and strand annotations, such as a bed file. The default
structure of these files is like a bed file in which the chromosome is in
column 1, position in column 2, position in column 3, and strand (+ or
-) in column 4. The program will automatically switch orientation based on
strand. For this field, you may either upload your own file or use one of the
common gene annotations found in the dropdown menu. In addition, multiple
annotation files may be uploaded in this case, each signal track will be
aggregated separately over each annotation track; however, a single plot with
each factor across a different annotation track will also be generated.
Number of bins (n). Specifies how many bins
will be in each flanking region (for a total of 2xn bins).
Number of bins (m). Optional field to be defined if stop and start sites (regions) are to be
considered in the aggregation process. Defines the number of bins assigned to
the region between start and stop sites (for a total number of m+2m bins).
Flank Region Length. Specifies number of base pairs the program should analyze in both
directions from either the start site or the start/stop pair, depending on the
option specified.
Minimum gene length: Tells the program not to consider annotations for
start/stop pairs that are shorter than a certain number of base pairs.
Use mean.
Regardless of whether this box is checked or not, the program will
automatically ensure that only the median signal of an individual gene (or
number of probes, if the density option is selected) contributes to the final
averaging calculation in each bin to avoid bias against shorter genes. If use mean is selected, the program will
take the mean signal across all genes per bin and report the final result. Otherwise,
it will use the median signal (of the median signal of each gene).
Output
Output.txt is a text file containing
two columns of numbers. The first column is bin number, where the negative
numbers correspond to all the bins before the start site, and the second column
is the average intensity. This can be visualized using the graph generated by
the tool.
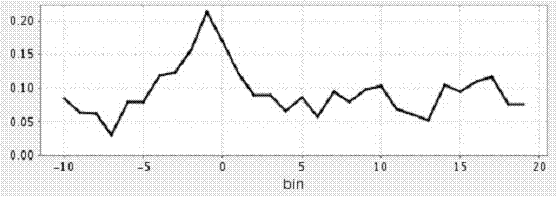
For example, in the above,
positions -10 through 0 correspond to the n bins before the start sites.
Positions 0 through 10 correspond to the m bins in between the start and stop
sites. Positions 10 through 20 correspond to the n bins after the stop sites.